
Update history: period, charts, CSV
Update history shows how the inkspace’s items changed with every update, for the inkspace as a whole and for each channel. You choose the days to look at, and the charts and the CSV files follow.
The overview and the window
Section titled “The overview and the window”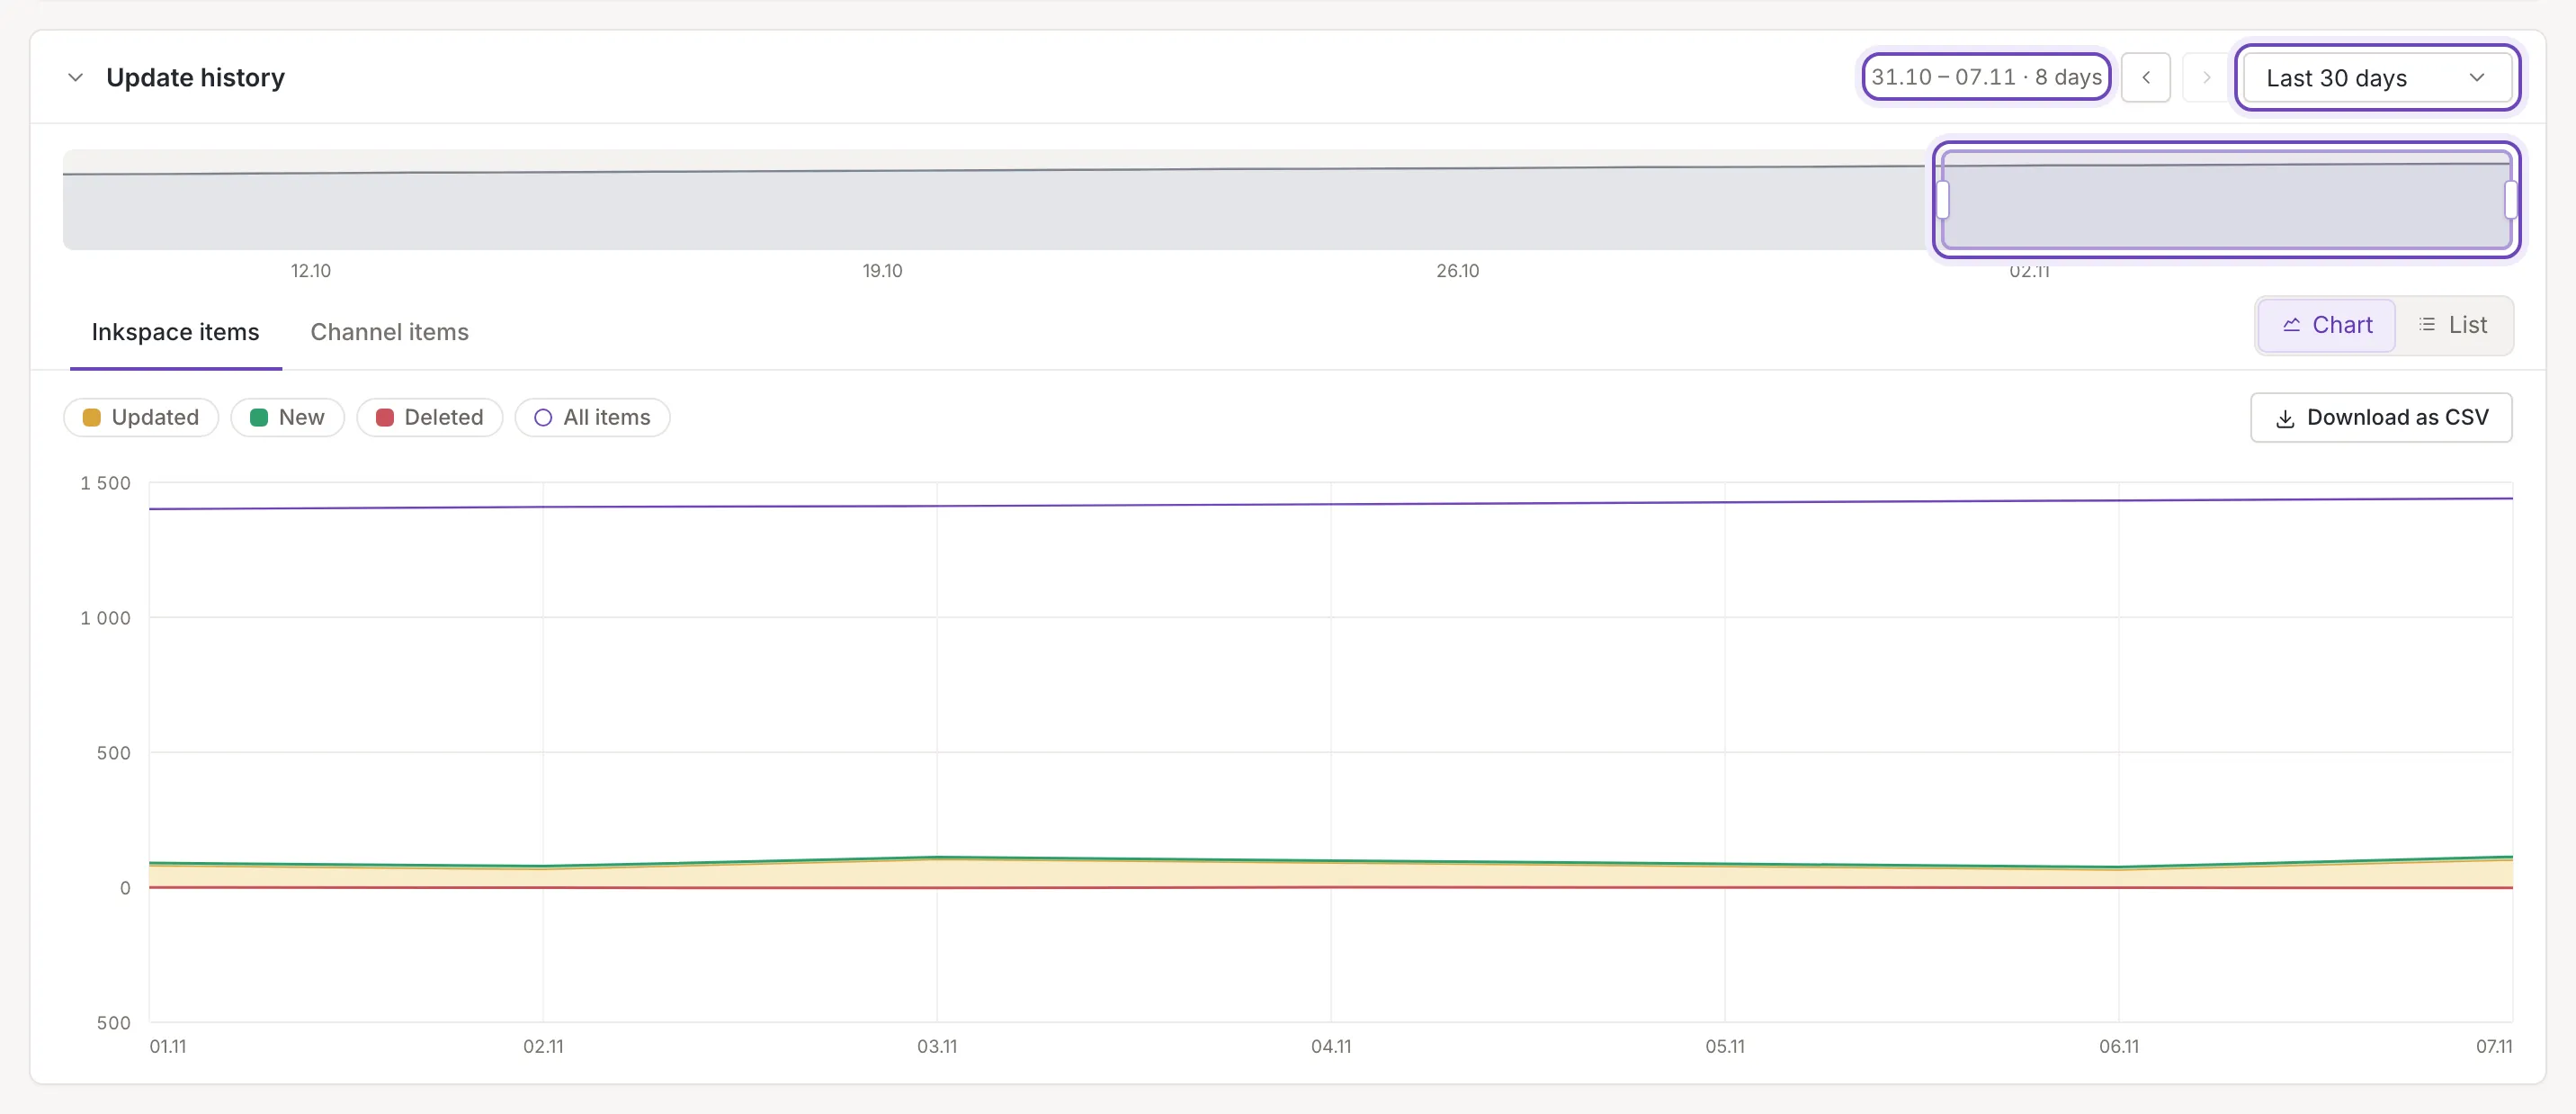
The strip at the top of the section is an overview: the number of items on each day of the whole period (one point a day, from the day’s last update). The lighter frame on it is the window: the days the chart below shows, and the days a CSV file holds. The window starts as the latest 7 days.
- Drag the window to move it.
- Drag its left or right edge to make it shorter or longer. While you drag, the window says how many days it holds.
- Click the overview outside the window to put the window there.
In the head of the section a label gives the window’s first and last day and the number of days it holds, for example “31.10 – 07.11 · 8 days”. Both end days count, and dates are in the inkspace’s time zone. Updates that failed are marked on the overview. The window drives the charts and the Per channel list. The list of updates does not use it (Inkspace items and Per channel lists).
Period, Earlier and Later
Section titled “Period, Earlier and Later”The overview covers a period, chosen in the select Period at the right of the head: Last 30 days, Last 90 days or Last 180 days. A visit starts with 30 days. An inkspace that is younger than the period starts its overview at its first update.
The two arrows move the window by its own width: Earlier towards older days and Later towards today. An arrow is dimmed when the window cannot go further: at the start of the period, or at today.
Tabs and views
Section titled “Tabs and views”Two tabs choose what the charts show: Inkspace items, the items of the whole inkspace, and Channel items, the items of each channel’s feed. Next to the tabs, the switch View offers Chart on both, and List on the first or Per channel on the second: the same data as a table.
The tab, the view and the period are not remembered: each visit starts on the first tab with the chart and a period of 30 days. (The channels you pick on the Channel items chart are remembered, see below.)
The inkspace items chart
Section titled “The inkspace items chart”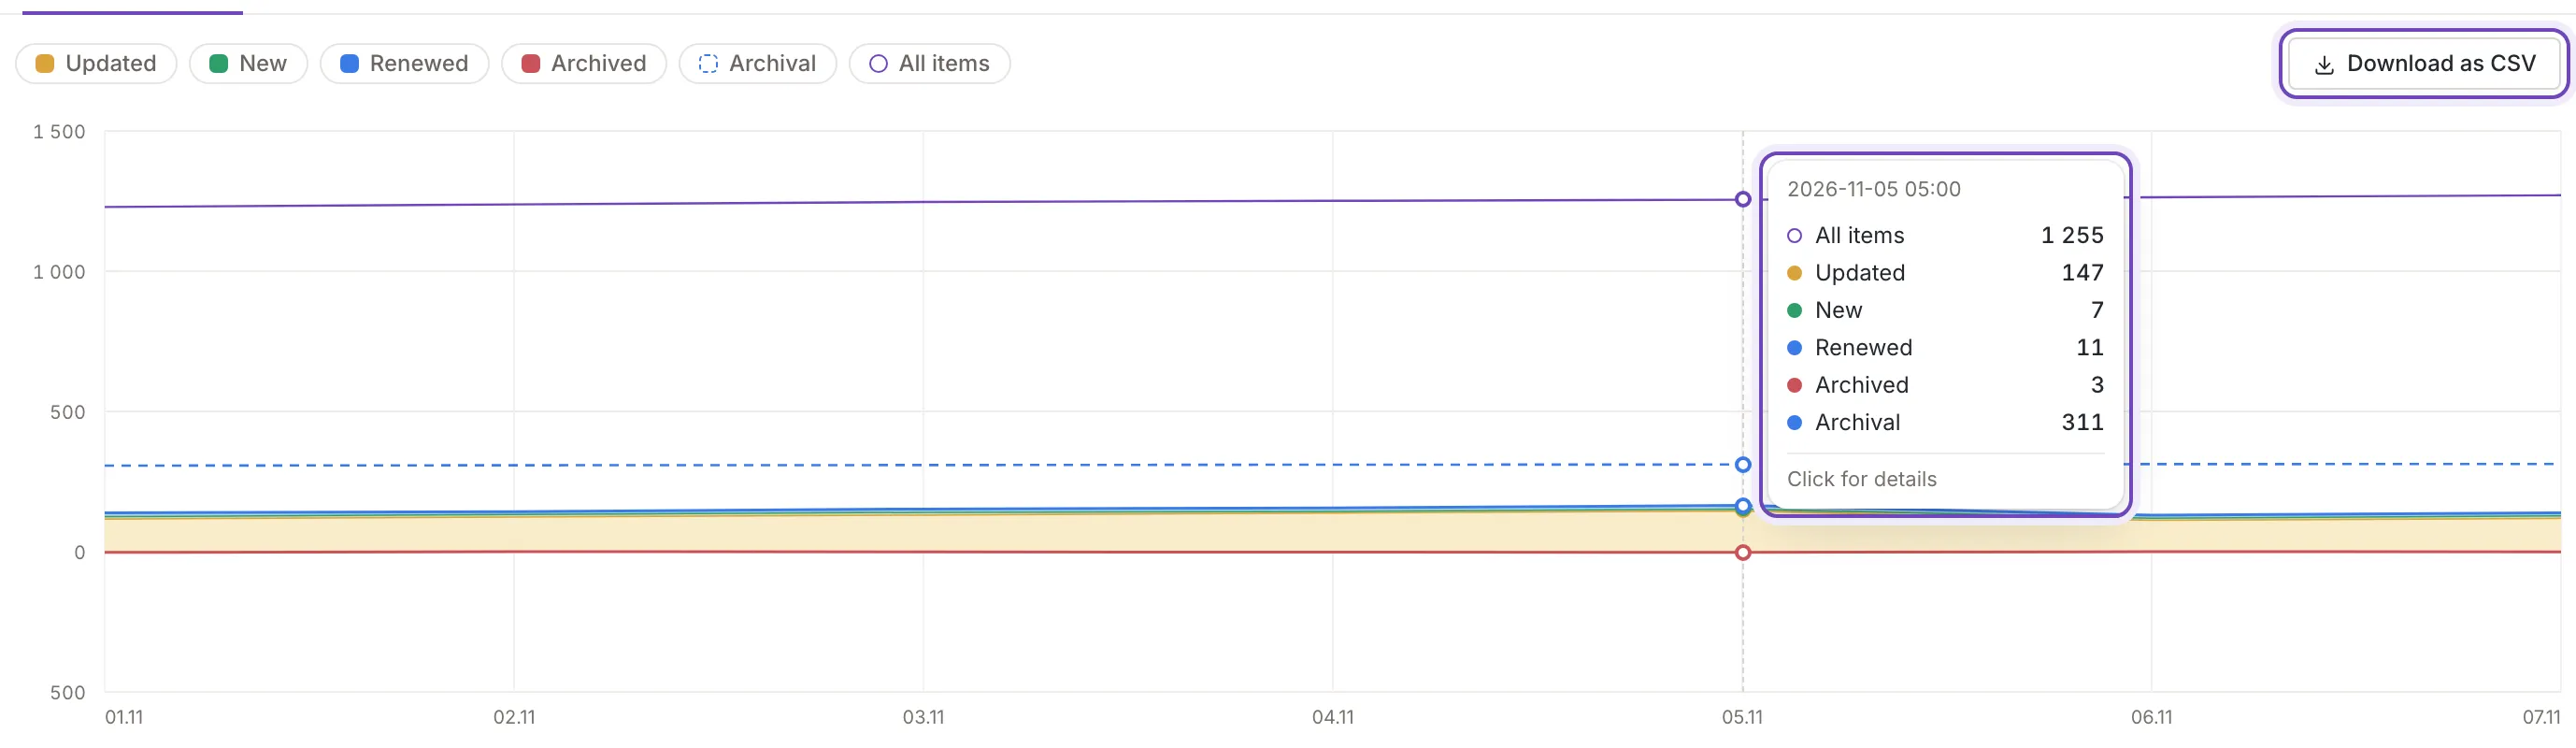
The chart draws the updates that succeeded, one column for each, at the time the update finished:
- Updated and New are stacked above the zero line.
- Deleted is drawn below the zero line. In an inkspace that keeps archived items it reads Archived, and the chart also shows Renewed and a dashed line Archival.
- All items is the line with the number of items after the update.
Point at the chart: a guide marks the nearest update and a box lists its date and the numbers. A line with nothing in that update is dimmed at the bottom of the box. The box ends with Click for details: click to open that update’s steps (Update details).
An update that failed has no counts. It is a red dot on the All items line, and the box says Update failed. Failed updates on the dashboard follows one from the dot to its reason.
Each name above the chart is a filter: click it to hide that line or show it again, and Clear filter brings every line back.
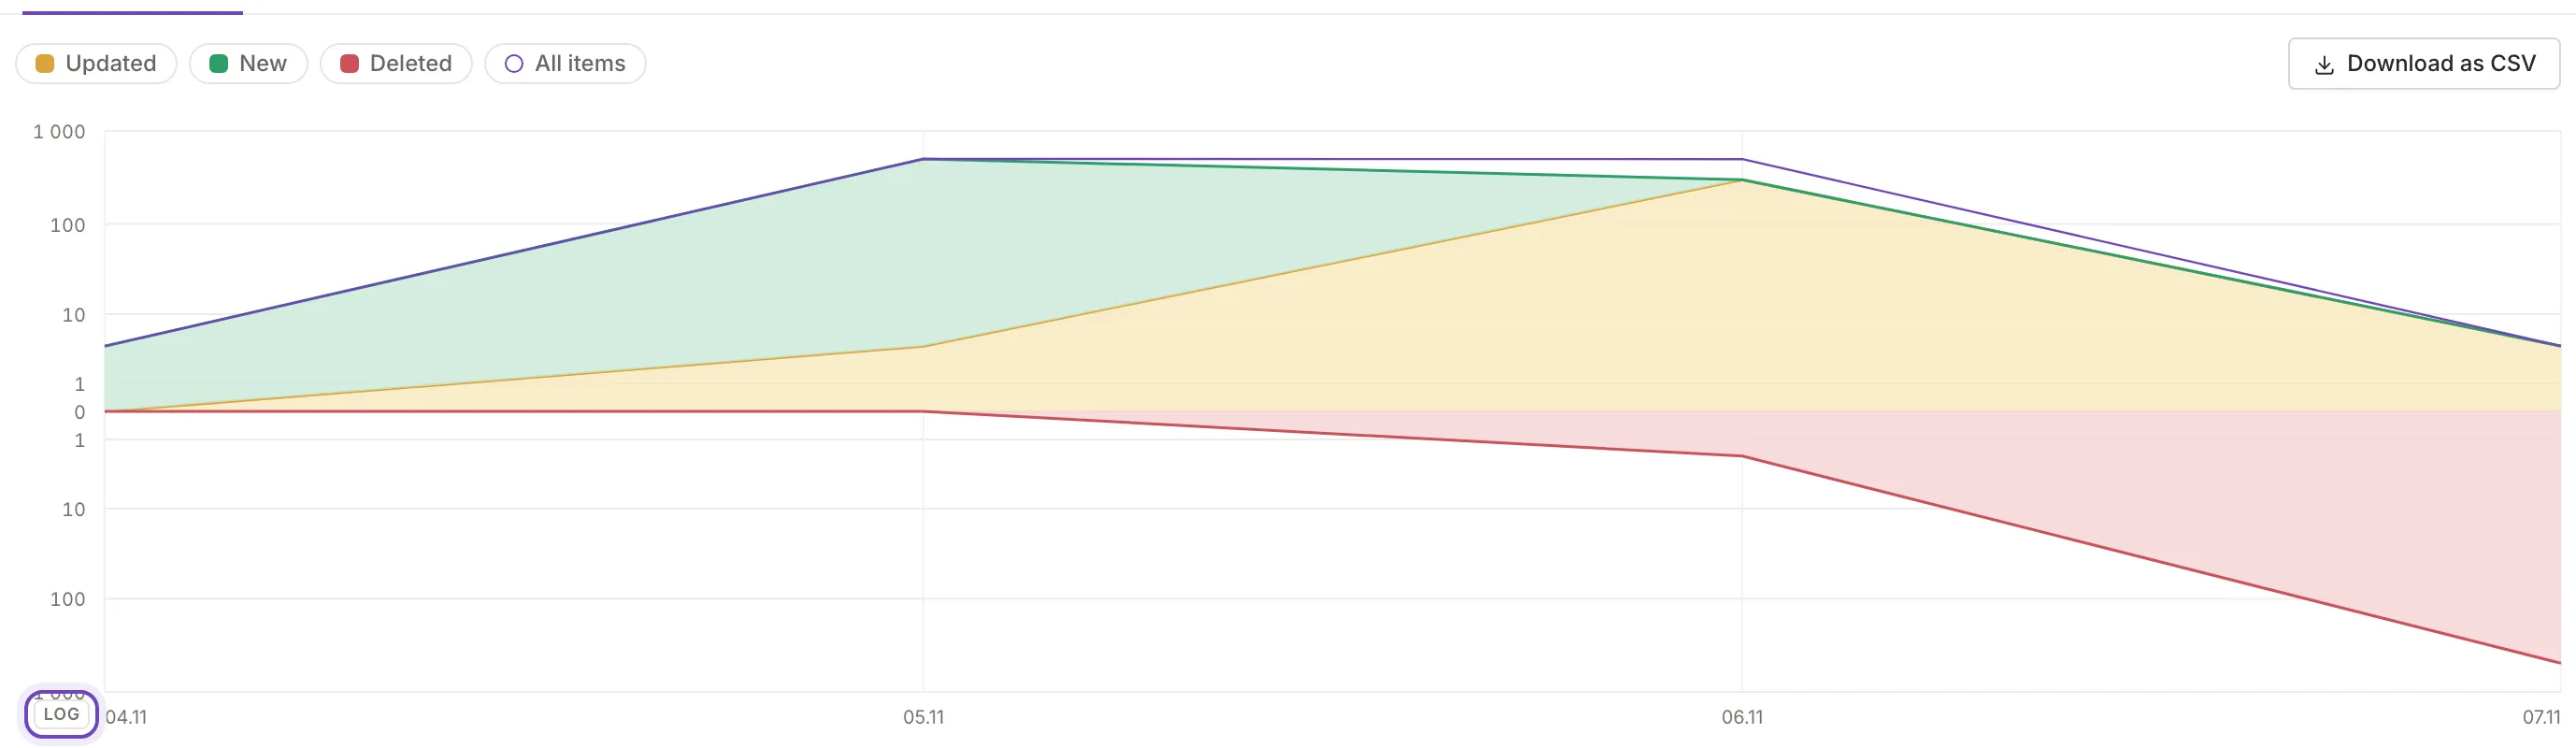
When the biggest and the smallest values in the window differ by more than about 20 times, the vertical scale becomes logarithmic so the small values stay visible. A small badge, log, shows it in the bottom left corner, and pointing at it says Logarithmic scale: the values in this period differ a lot. Hover to see the exact numbers.
The channel items chart
Section titled “The channel items chart”Under Channel items the Chart draws one line for each channel, with the channel’s icon: how many items its feed held after each update. Channels that held the same counts through the whole window are drawn as one line; its name shows “+1” or more, and pointing at it lists the channels.
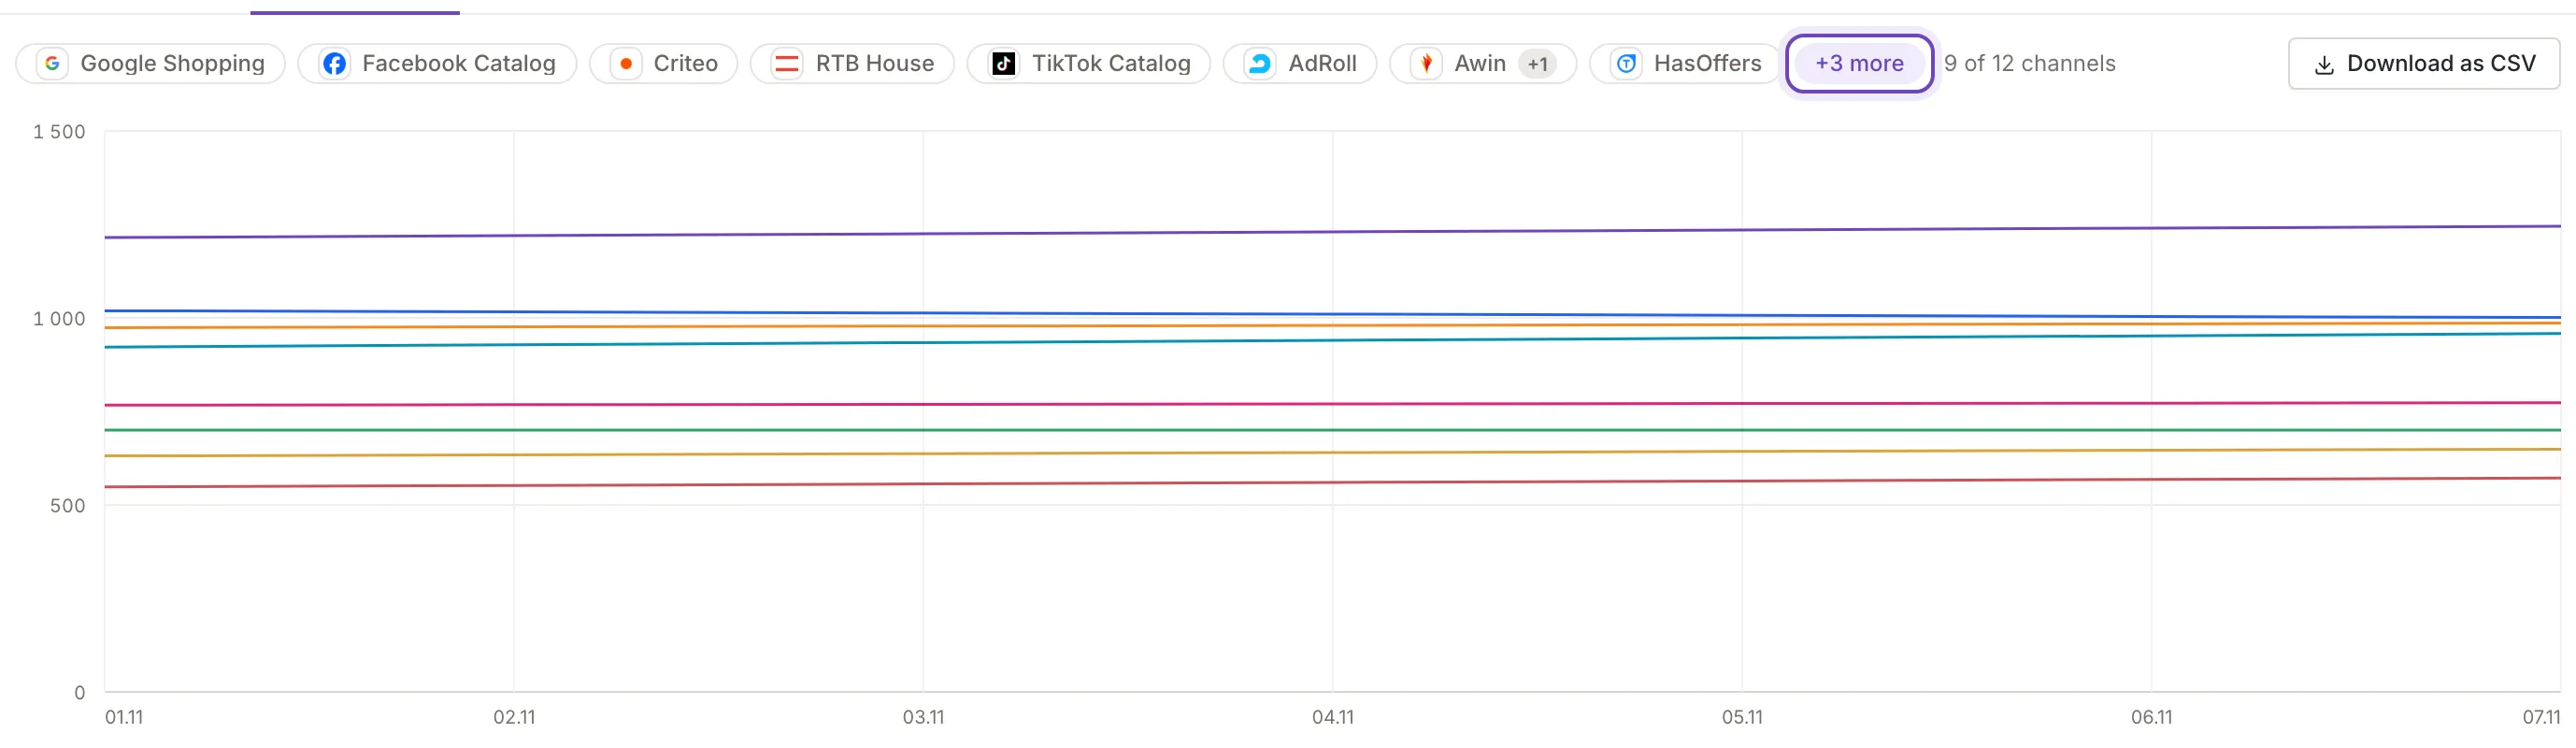
At most 8 lines are drawn at once, and channels drawn as one line count as one. When the inkspace has more lines than that, the 8 with the most items are drawn first and a button after the names opens the list of all channels. It says how many channels are not drawn while there are some, and Choose channels when all are. In the list:
- Find a channel narrows the channels by name.
- A box in front of each channel draws or hides its line, with its latest count at the right. Once 8 lines are drawn, the other boxes are off.
- Most items and Biggest change draw the 8 channels with the most items in the window or the biggest change, and Clear draws none, so that you can tick the ones you want.
- While the button is there, a click on a name above the chart takes that line off the chart, instead of hiding it.
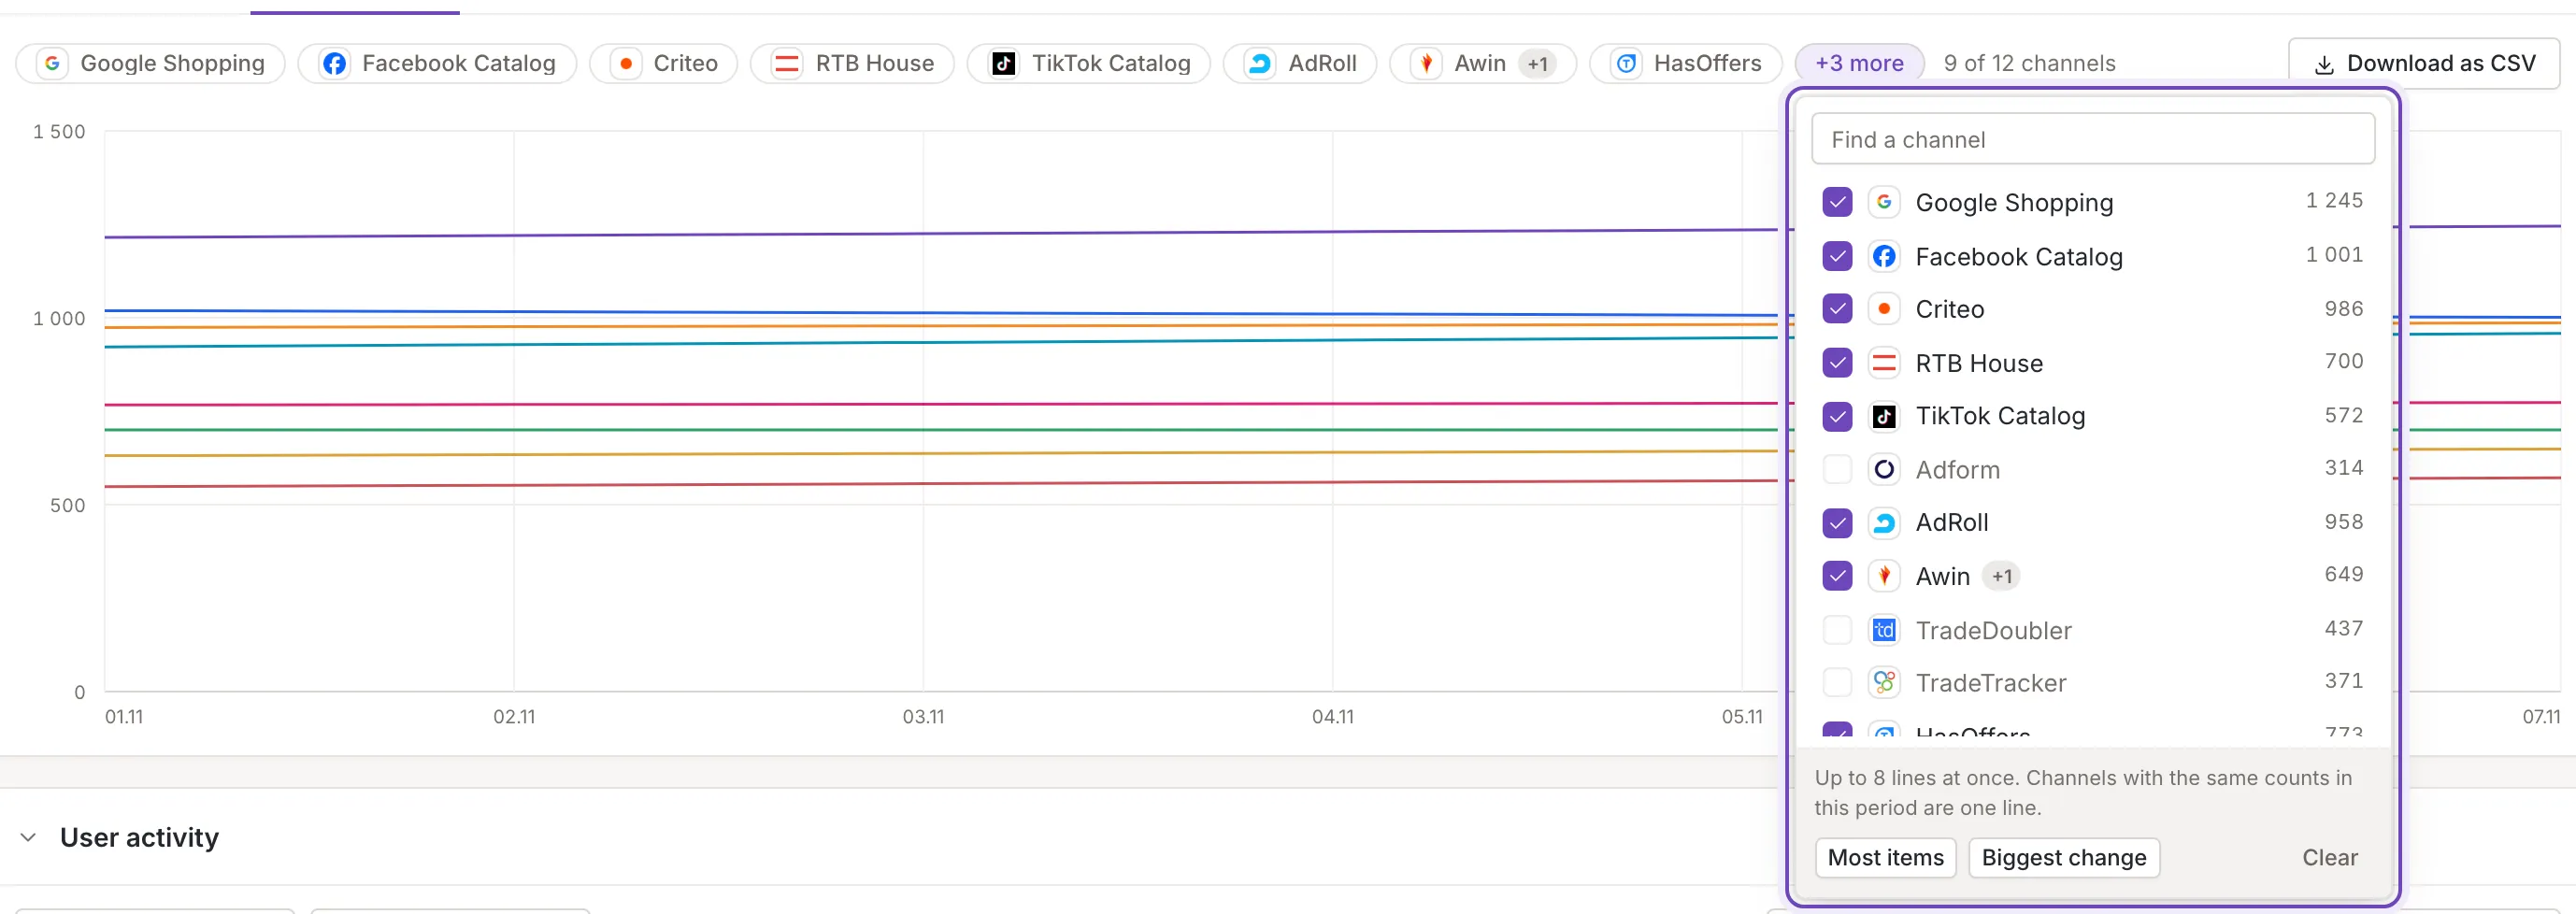
Your choice is kept in this browser for each inkspace, so the chart comes back as you left it, but not on another computer. A column where a channel’s update failed has a red mark, and the box points to the list of channels, where that failed update opens (Per channel list).
Download as CSV
Section titled “Download as CSV”The button Download as CSV sits at the right of the names above both charts and above the Per channel list. It saves the window as a file and is missing when the window holds nothing.
- Inkspace items:
inkspace_<id>_inkspace_updates_<date>.csv, one row for each update that finished in the window, failed ones included. Columns: Date, All items, Updated, New, Renewed, Archived / deleted, Archival and Status. - Channel items:
inkspace_<id>_channels_updates_<date>.csv, one row for each successful update of each channel in the window, channel after channel. Columns: Date, Channel and Items.
The file’s date is today’s, in your browser’s time zone. Cells are separated by semicolons, and the dates inside the file are
written as 2026-11-05 05:00 in the inkspace’s time zone. A text that starts with =, +, - or @ gets an apostrophe
in front, so that a spreadsheet does not take it for a formula. If accented letters look wrong when you open the file,
import it and choose UTF-8. The same button saves User activity.
When there is nothing to show
Section titled “When there is nothing to show”- No update yet: No updates yet. The history starts with the first inkspace update.
- No updates in the window: the chart says No updates in this period (on Channel items: No channel updates in this period) and when the last update was. Show the last update moves the window onto it, and widens the period when it does not reach that far.
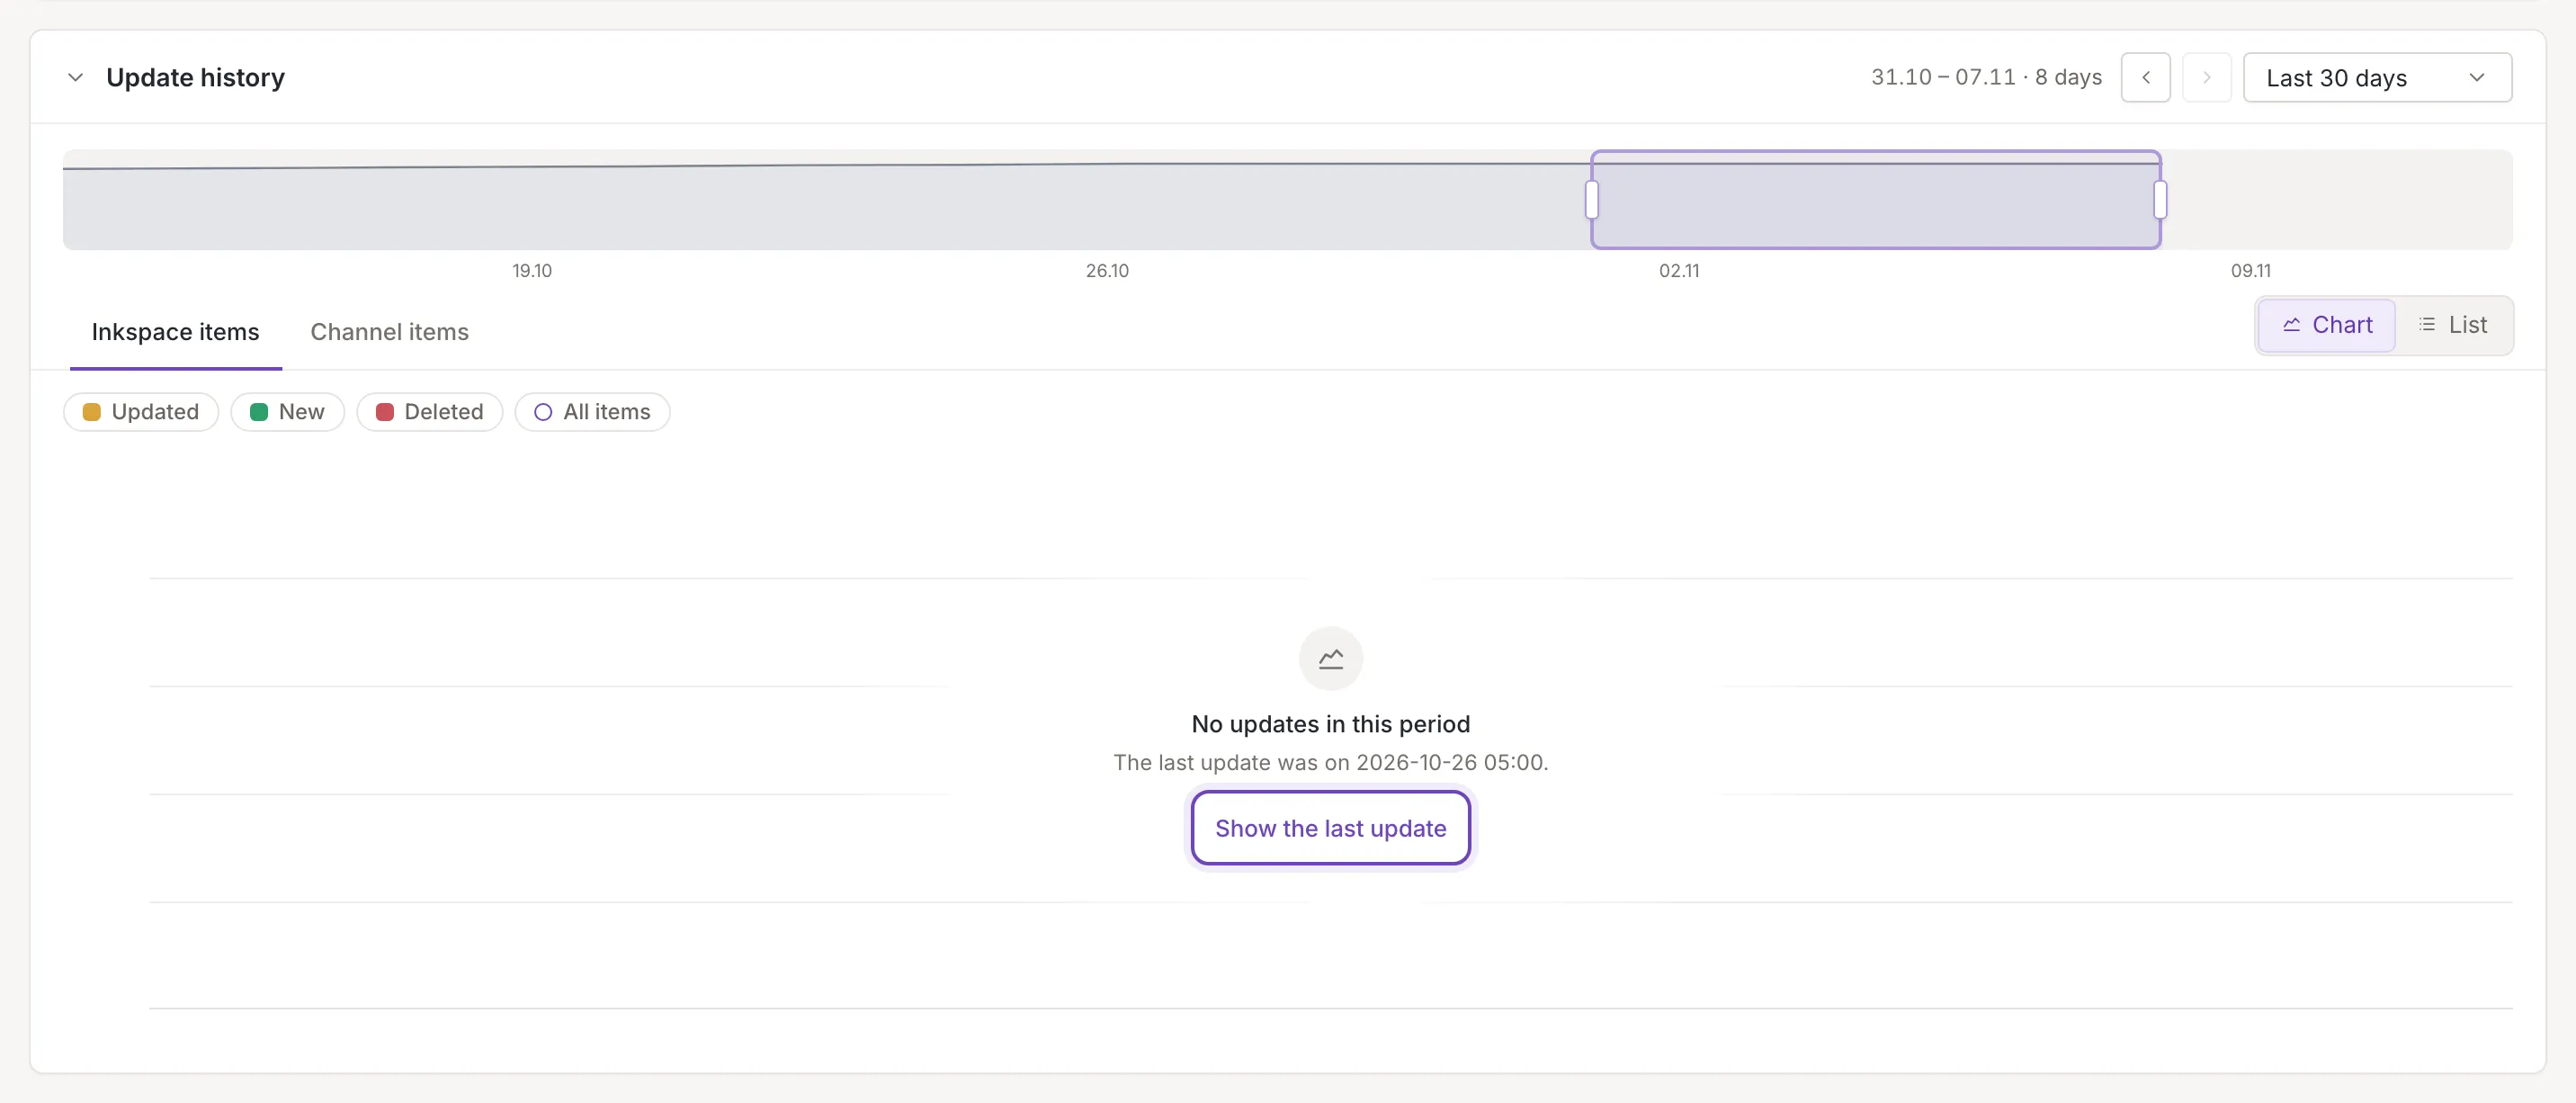
- The history could not be read: Could not load the update history with the hint The server did not answer. Try again in a moment. and the button Try again.
- Loading: grey blocks take the place of the overview and the chart.
When an update finishes, the history refreshes by itself: new updates appear without reloading the page.